

The Scottish Council for Voluntary Organisations is the membership organisation for Scotland's charities, voluntary organisations and social enterprises. Charity registered in Scotland SC003558. Registered office Caledonian Exchange, 19A Canning Street, Edinburgh EH3 8EG.
How to become a data-driven charity
The Q&A session with the three expert speakers on our DigiShift on Data-Driven Charities was one of our most active sessions. Scottish charities are definitely interested in why and how to better use their data.
Our expert speakers
Steve MacLaughlin from Blackbaud made it clear he is not a data person. He was never good at maths or statistics but he knew data was powerful and wanted to understand how to use it. He is the author of the highly acclaimed book Data Driven Nonprofits written for non-data people.
Our two data experts were
• Brian Hills from Data Lab Scotland, whose mission is to help Scotland maximise value from data and lead the world to a data powered future
• Giselle Cory from DataKind UK, a community of volunteer data scientists who use their expertise to help charities use data to improve their services for social good
Why use data
You probably already use your data to show impact - but your data can help you do so much more. You simply need to switch from reporting data to being hypothesis driven.
“Data is the raw material for adding value to your charity”
Steve MacLaughlin, Blackbaud
Sometimes we shy away from using data because it is messy; or we don’t understand it. This is perilous because as Steve puts it
"Without data, decisions are left to tribal knowledge or worse, the whims of the Highest Paid Person’s Opinion (HiPPO)"
Steve MacLaughlin, Blackbaud
The best argument you have against your HiPPO is your data. Turn your data into information and use that information to drive action to lead improvement or change.
How to use your data
Most organisations are using data less well than they could be, not just charities. Most organisations have few resources; feel they are miles behind; and are not sure where to start.
When an organisation does start to look at data, many tend to jump in the deep end with a huge data strategy that stalls.
You need to pause and identify what you want to achieve.
“Forget about data - take time to find out what the problem is”
Giselle Cory, DataKind UK
You need to map out your processes, identify your challenges, then think about which might be helped with data.
When Brian talked about how your charity can incorporate data into your services, he advised
"Root your data in the challenges you are trying to tackle"
Brian Hills, Data Lab Scotland
Pick one small issue where data will easily fix something. Use this quick win to gain support and traction to continue using data.
Top tips
• Find the goldilocks issue
Start with something that is big enough that people care about it; but not a big enough problem that everyone cares
• Make a start
Give yourself 30 days to do some research & analysis; and make recommendations on change or next steps
• Think about your people and what basic tools already exist
A lot can be achieved using Excel pivot tables. You likely don’t need a shiny new expensive platform.
• Keep going
Once you've solved one issue, find another issue to investigate, and repeat. If you keep doing that, you will eventually become data driven
Often it really is as simple as just making a start! Sometimes it requires culture change.
Culture change
The culture of your organisation is set by your people, by what they do every day with their peers & colleagues & service users.
If you want your organisation to be more data driven, you need to find a way to include data in everyday decisions. You need to create a culture of sharing, of data champions, and of change.
Culture of sharing
- encourage sharing of data, information and knowledge
- encourage cross-organisational work
- work collaboratively with other organisations
Culture of champions
- encourage your people to champion your data
- empower your internal data champions - you likely already have someone who can use Excel well. Find them!
- there might be people in your organisation who want to develop their skills. Find them!
- the free online Data Lab course Driving Value from Data will help your champions learn how to understand the importance of data to your organisation
Culture of change
- Change can be scary, so you need to highlight that change brings new and often hidden opportunities
- Change can be easy – just use a little more data every day in your decision making
- Use this Data Maturity Framework by Data Orchard to map and plan your charity's journey of change
Share your data - talk about it and display it
Choosing how to display your data can be a creative journey into infographics. To get started, keep it simple.
Steve recommends using a bullet chart. This is a simple chart which summarises targets and progress. It is an effective way to show whether projects are on target.
Bullet chart example
For example a project which has a target of delivering 5 sessions and reaching 50 users might look like this after 2 sessions.
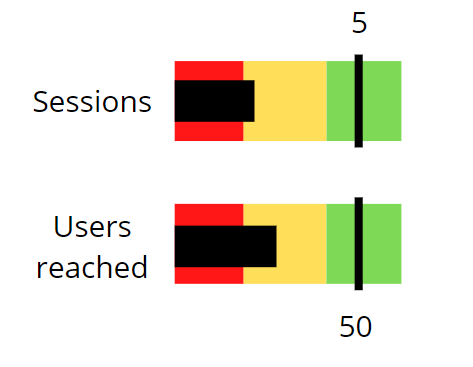
If the "users reached" bar looked the same after 4 sessions, you would have a quick visual highlighting the issue. Displaying this prominently, where all staff can see it, keeps them informed and encourages them to be proactive in seeking out solutions. If the "users reached" bar was already at 50 after 2 sessions, all your staff could see their achievement and gain a sense of pride and accomplishment.
There are multiple ways to display data and NPC have produced an excellent guide Data visualisation: What’s it all about?
You may even want to create a dashboard to display your data like the Citizens Advice live dashboard of searches by general public on their website or Street League’s interactive impact dashboard showing how they have helped young people from disadvantaged communities.
Remember responsible data use
Responsible use of data should be at the heart of this. There are data protection laws and rules you must follow. This can feel overwhelming but it is mostly common sense:
• have consent
• tell people how and where you will store their data
• only share anonymised data
You should also think about the repercussions of your data collection and underpin everything with ethics. A good rule of thumb is that you shouldn't collect it unless you plan on doing something with it.
"Data leads to information, which should lead to action.
Steve MacLaughlin, Blackbaud
Imagine you had the information – what would you do with it?
If you don’t know, don’t collect it."
Eddie Copeland’s four-step method will help you figure out what questions you want to ask and prioritise the data you need to collect.
Get help
Often a data champion, with knowledge of Excel, will be all that you need. If you need more, reach out! You are not alone - there is a lot of free support on offer to build your data capacity.
- A great place to start is with SCVO’s digital checkup tool. This helps you assess your current digital maturity, benchmark how this compares to other organisations and plot a route ahead.
- Learn from others - there are great Data Lab case studies on the impact of harnessing data and Citizens Advice's blog about how they are using their data to transform.
Once you know what you want to do, find an organisation that has already done it. They will help you! Ask in your networks, ask SCVO or ask Data Lab Scotland.
- DataKind UK's Office Hours programme is open to any non-profit organisaton in the UK. In these monthly drop-in sessions you have the opportunity to speak to a data expert for an hour about any data issue or advice you need.
- Data Lab Scotland regularly look for projects as placements for their masters students. This blog shows a student placement can have a huge impact on how your charity uses it’s data.
- Data Lab Scotland also supports organisations to unlock their data to innovate, as shown in this case study on how data can help charities measure success.

